One graph, four maps
How do I read my product? Put everything in one graph, then look at it from the angle your question needs.
Most product knowledge lives in five tools that never agree: the flows in a design file, the endpoints in an API doc, the tables in a schema, the status in a tracker. Arkaik starts from the opposite bet. There is one graph, and everything else is a way of reading it.
So the first thing to understand is what goes into that graph, and how its pieces hold hands.
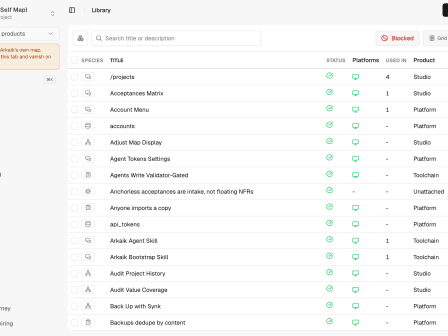
Six kinds of things and eight kinds of links: the whole product in one place.
Navigation is how people experience a product, so it is the first reading. Follow a user from the top-level flow down to the screen they tap.
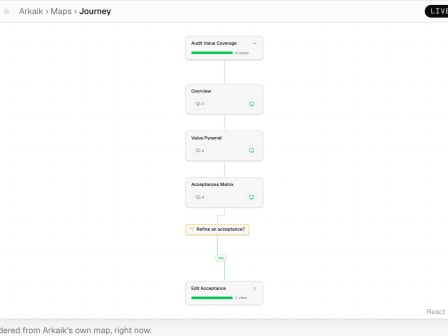
Your flows as playlists of screens, with the forks and conditions drawn in.
Then flip the map over. Every backend change starts with the same question: which screens show this, and what does this endpoint feed?
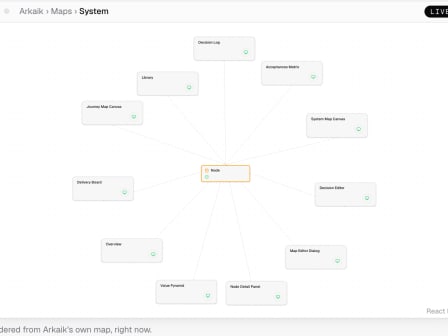
Screens, endpoints and data models in tiers, with the wires between them drawn in.
Screens are not tasks, so a task tracker cannot tell you what is in flight on Android. The delivery board can, because it reads the same graph per platform.

What is in flight on each platform, screen by screen, not task by task.
And when you just need to know where the product stands, one screen deep, there is the overview.
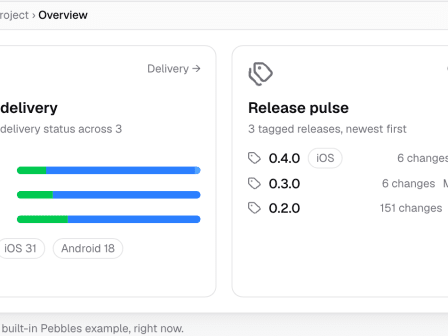
One screen that says where the product stands, and links you to where the detail lives.
A strategist zooms out, an operator zooms in, an agent queries. Same data, four maps, no copy to keep in sync.
Journal
- Maps landMilestone
- The system map landsMilestone
- Bundle v2 and validationMilestone